Hi, my name is Yoon Lee
Data scientist based in Boston.

My Resume

About Yoon

Profile Image

Hi, I'm Yoon.

I'm a data science consultant at Management Solutions in Boston, working with banking clients on regulatory reporting and data quality — translating messy business logic into production SQL and scalable pipelines on GCP. Came to data through statistics at UIUC, with prior consulting stints at EY in Seoul and Chicago. Mostly work in Python, SQL, and GCP these days, with R, Selenium, and a long tail of other tools picked up along the way.

Outside of work: collage-based digital art, fashion, running, reading, cooking, and an embarrassing amount of Brawl Stars.

Where I’ve Worked

  • Management Solutions
  • EY Blockchain
  • EY Seoul

Data Science Consultant @ Management Solutions

Sep 2024 - Current

  • Migrated a legacy Data Quality tool to Google Cloud Platform for a top US bank's Regulatory Reporting team, converting parameterized rule definitions into rigorously specified logic for enterprise-scale validation.
  • Translated business-defined rules into production-grade BigQuery SQL, standardizing ambiguous parameterized logic into deterministic queries that strengthened data integrity in regulatory submissions.
  • Designed interactive Looker Studio dashboards visualizing MoM/QoQ trends, line-item variances, and cross-repository comparisons that accelerated anomaly detection for stakeholders.

Technology Consulting Intern @ EY Blockchain

Jun 2023 - Aug 2023

  • Directed comprehensive analysis of blockchain protocols, enhancing financial traceability and transparency for an NGO’s fund disbursement system.
  • Developed 10 data visualizations using Tableau to track developer activity and network performance, improving client-facing reporting efficiency by 25%.
  • Managed cross-functional teams across business, design, and engineering, driving a 15% increase in product adoption.

Digital Technology Consulting Intern @ EY Seoul

Jun 2022 - Aug 2022

  • Conducted market research and analysis on global smartphone and wearable markets, providing strategic insights that improved market prediction accuracy by 20% and supported strategic marketing decisions.
  • Analyzed and cleansed over 1 million social media sentiment data points, delivering data-driven insights that increased client engagement metrics by 25%.
  • Automated data extraction and cleansing processes using SQL, enhancing data processing efficiency by 35% and reducing manual labor by 40%.

Things I've made

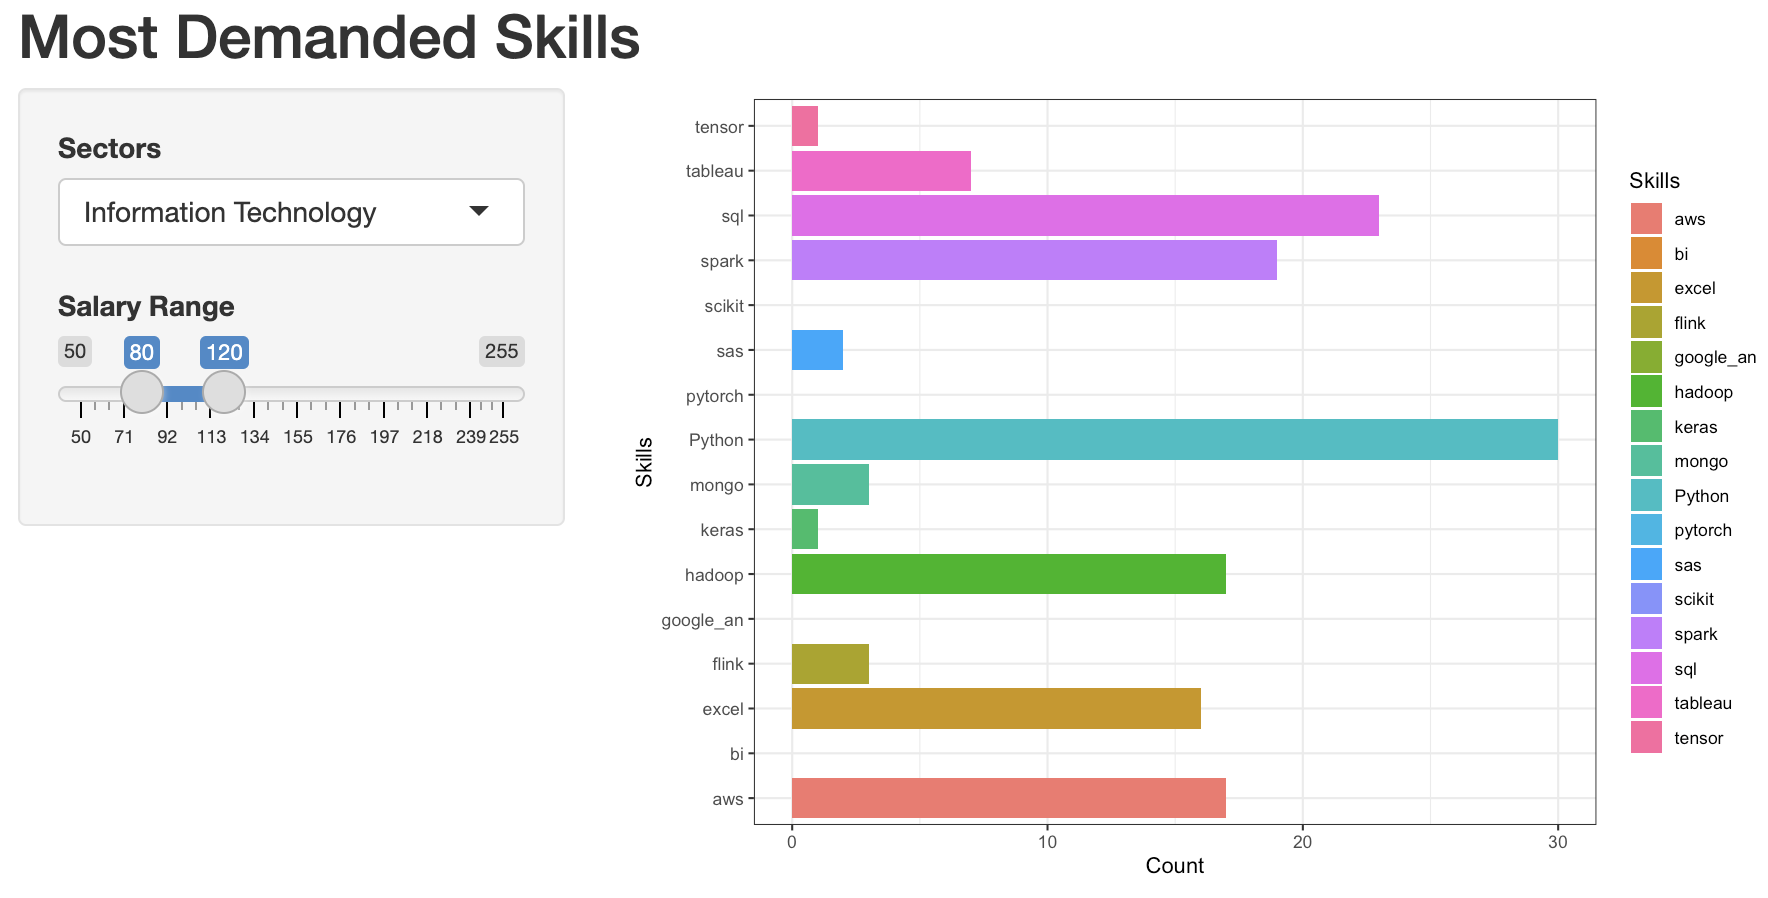
Data Scientist Salary Insight

Wrote R Script and deployed it with shinyApps. Tidyverse was heavily used to wrangle and visualize the salary data obtained from Kaggle. The app generates bar chart that depicts how much each technical skills are required by the given condition of data science jobs like salary range or Industry Sector.

Game Sales Data visualization

Created a data visualization using Tableau that shows game sales by genre and time, top 10 game name by sales, and top 10 gaming platforms by sales. Utilized area chart, bar chart, and bubble plot.

NFT Digital Art

Mainly Collage by pictures that were taken by me and modified by me! I used Photoleap and Canva on my iphone to make this collage. Every pieces that I wanted to publish is on-chain, so feel free to visit my Opensea page!

Contact

Feel Free to Reach Out!

Email Me!